Umami Heatmaps: See How Visitors Really Use Your Website
Updated: August 2026
Analytics can tell you what visitors do. Pageviews, sessions, bounce rates, and events can all help you understand what is happening on your website.
But sometimes you need to know something more visual: where are people actually interacting with your website?
That’s where Umami’s Heatmaps feature comes in.
Heatmaps give you a visual way to understand how visitors interact with your web pages. Instead of looking only at numbers and charts, you can see interaction patterns directly on the page — helping you identify the areas that attract attention and the elements visitors interact with most.
What is a heatmap?
A heatmap is a visual representation of activity on a webpage.
Rather than simply telling you that a page received a certain number of visits, a heatmap can help answer questions such as:
- Which parts of the page receive the most interaction?
- Which links and buttons are visitors clicking?
- Are important elements being overlooked?
- How are visitors interacting with different parts of the page?
Activity is represented visually, making patterns easier to spot than they would be in a traditional analytics report.
Umami Heatmaps: a visual layer for your analytics
Umami has traditionally focused on giving you straightforward, privacy-focused website analytics without overwhelming you with unnecessary complexity.
The Heatmaps feature adds another dimension to that approach by giving you a visual representation of visitor interactions.
Once you've enabled heatmaps and collected data, you can use them to get a more intuitive picture of visitor behavior. This can be particularly useful when you're trying to improve a landing page, navigation, call-to-action, or other important part of your website.
Instead of asking only "How many people clicked this?", you can start asking "Where are people interacting, and what does that tell us about the page?"
How to Enable and Use Heatmaps in Umami
Ready to see your website through your visitors' eyes? Here's how to get started.
Note: The exact options and interface can change as Umami evolves. The steps below follow the current Heatmaps documentation. For the latest details, see the official Umami Heatmaps documentation.
Step 1: Make sure your website is using Umami
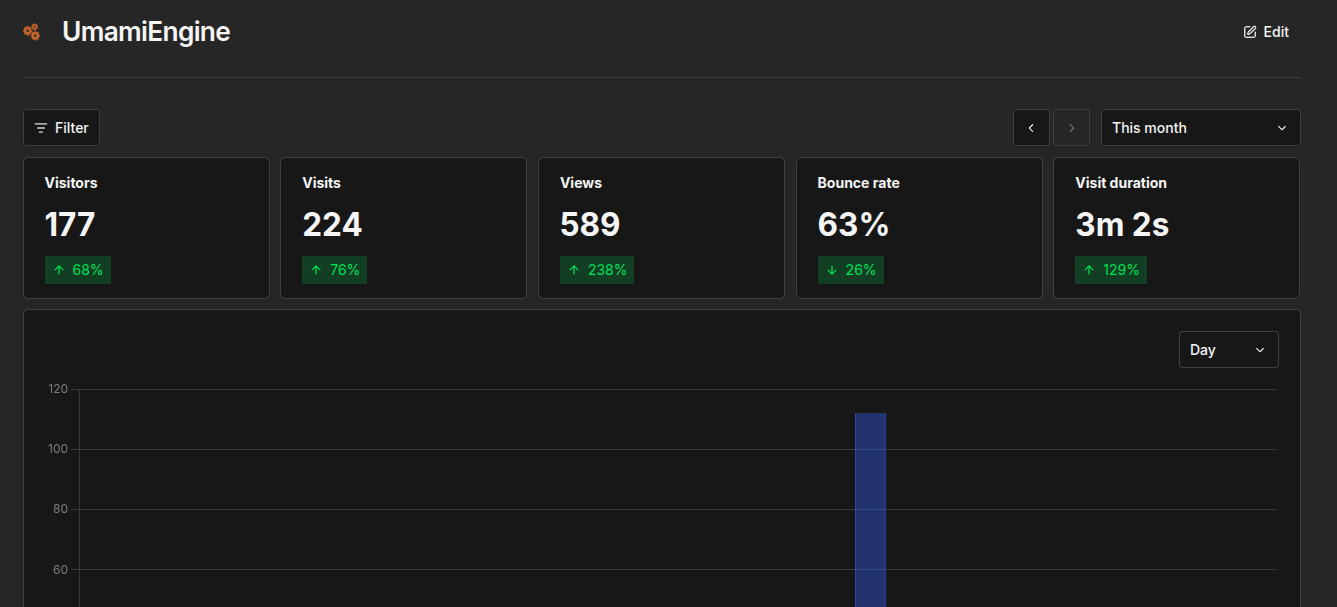
Before you can use Heatmaps, your website needs to be set up with Umami Analytics.
If you've already installed Umami and your website is sending analytics data successfully, you can move on to the next step.
If you're new to Umami, first add your website to your Umami instance and install the Umami tracking script on the site.
The important thing is that the Umami tracking code is present on the pages where you want to collect heatmap data.
Step 2: Enable Heatmaps
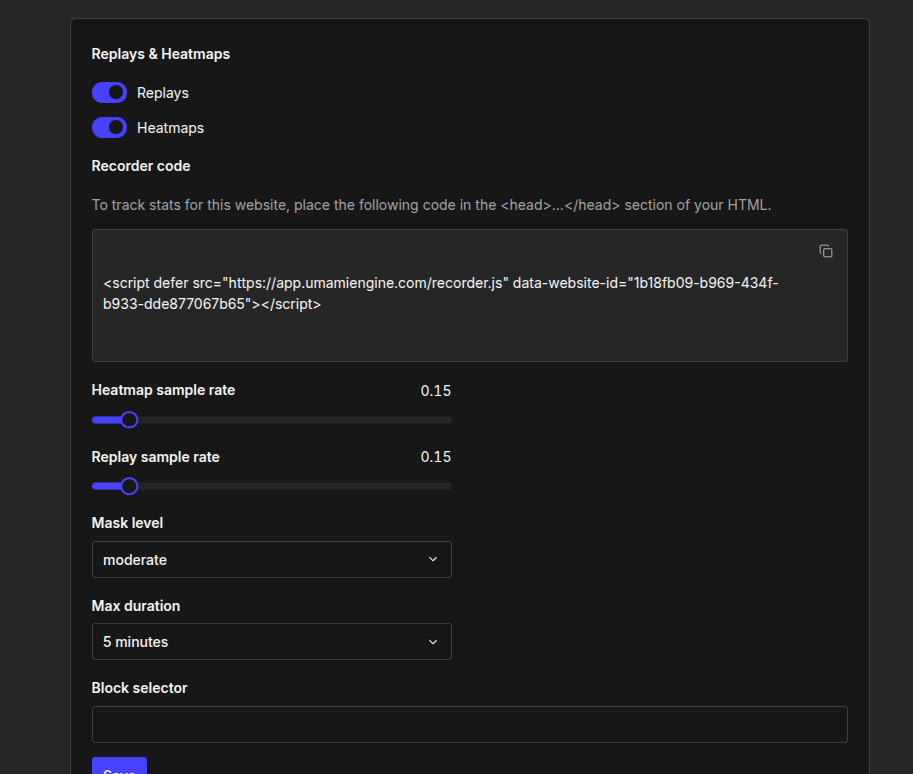
Open the website you want to analyze in your Umami dashboard and navigate to the Heatmaps functionality.
From there, enable Heatmaps for the website. hen, you need to copy the recorder script and paste it in your website so Umami can start receiving these information.
This allows Umami to collect the additional information required to build the heatmap.
It's worth remembering that a heatmap needs data before it becomes useful. If you have just enabled the feature, you may need to wait for visitors to interact with your site before meaningful patterns appear.
Step 3: Visit the page you want to analyze
Once Heatmaps is enabled, visit the page on your website that you want to analyze.
This could be:
- Your homepage
- A landing page
- A pricing page
- A blog post
- A product page
- A signup or registration page
- Any other page where understanding visitor interaction is important
Think about the questions you want the heatmap to help answer before you start analyzing it.
For example:
"Are visitors actually interacting with the CTA near the bottom of this page?"
That's a much more useful starting point than simply looking at a heatmap and trying to interpret every visual pattern at once.
Step 4: Open the Heatmaps view
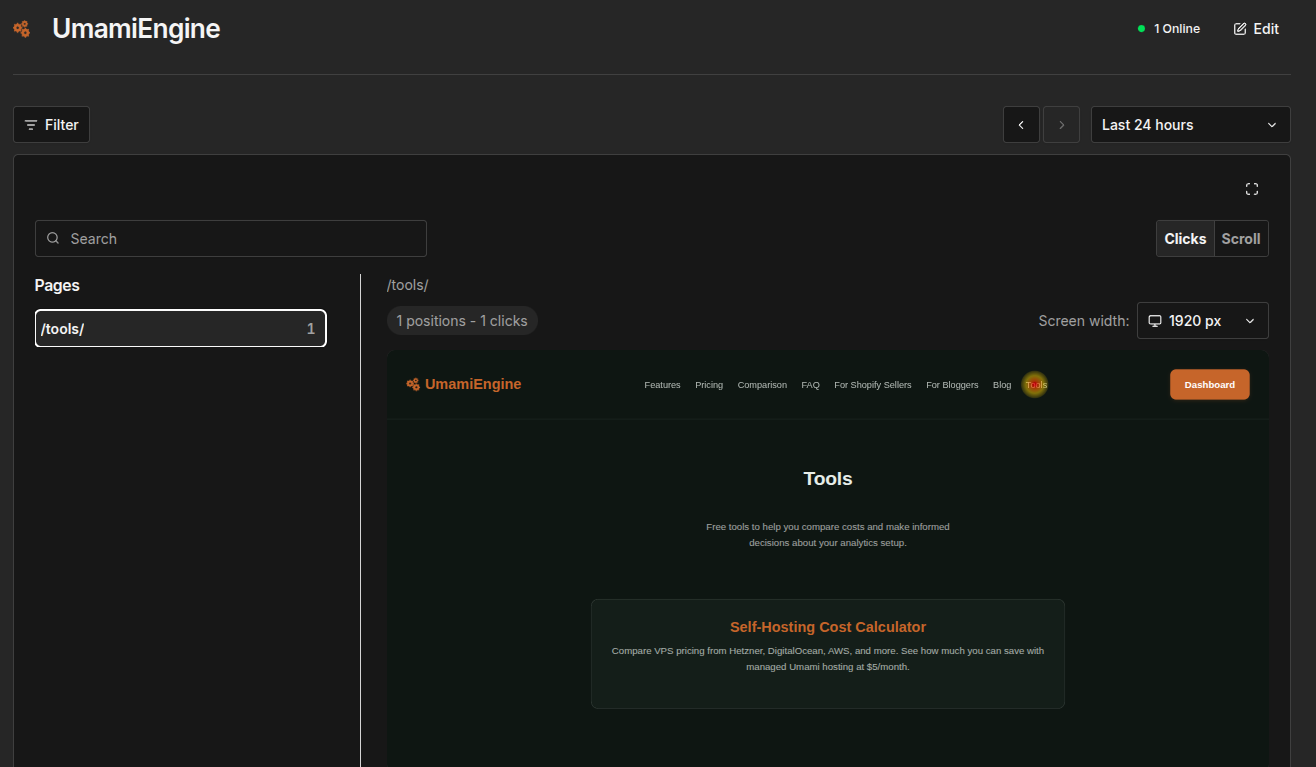
Return to your Umami dashboard and open the Heatmaps view for your website.
Select the page you want to investigate.
Umami will display the heatmap information associated with that page, allowing you to examine visitor interactions in the context of the actual page layout.
This is where the feature becomes particularly useful: instead of trying to mentally connect a list of URLs and click statistics with your website design, you can inspect the activity visually.
Step 5: Explore the interaction data
Now it's time to look for patterns.
Pay particular attention to the areas that matter most to your website.
For example, if you're analyzing a landing page, you might want to investigate:
Navigation: Are visitors interacting with the navigation elements you expect them to use?
Calls-to-action: Are important buttons and links receiving interaction?
Content: Are visitors interacting with elements within the content?
Unexpected areas: Are people clicking or interacting with things that you didn't expect to be interactive?
Don't assume that the most visually prominent part of your website is necessarily the part receiving the most interaction. That's exactly the kind of assumption a heatmap can help you test.
Step 6: Use the findings to improve your page
A heatmap is most valuable when it leads to an action.
Suppose you discover that visitors are interacting heavily with one part of a page while largely ignoring an important CTA.
That gives you a reason to investigate the page design.
You might consider whether the CTA should be repositioned, whether surrounding content is distracting visitors, or whether the CTA itself needs to be clearer.
The heatmap doesn't automatically tell you why visitors behave this way. Instead, it gives you evidence that helps you ask better questions.
Step 7: Measure the results
After making changes based on what you've learned, continue monitoring your website.
Compare your analytics before and after the change and use Heatmaps again to see whether visitor behavior has changed.
This creates a simple optimization cycle:
Measure → investigate → improve → measure again.
That's much more useful than making design decisions based purely on assumptions.
What should you look for in an Umami Heatmap?
It's easy to get distracted by the colors and visualizations. Try to approach your heatmap with specific questions.
Are important elements getting attention?
If an element is critical to your website's goals, you want to know whether visitors are interacting with it.
A heatmap can provide an immediate visual indication of how much interaction different areas of the page receive.
Are visitors interacting with unexpected elements?
Sometimes visitors behave differently from how designers expect.
Unexpected interaction patterns can reveal confusing navigation, interesting content, or elements that visitors perceive as clickable.
Is your page layout working as intended?
A page might look perfectly logical when you're designing it. Actual visitor behavior can tell a different story.
Heatmaps give you another source of evidence for evaluating your layout.
Where should you investigate further?
Don't treat a heatmap as a definitive explanation of visitor behavior.
Instead, use it to identify interesting patterns that deserve further investigation using your other analytics data and, where appropriate, usability testing or other research.
Heatmaps and your existing Umami analytics
Heatmaps aren't intended to replace your existing analytics.
They work best alongside the rest of the information Umami provides.
For example, you might use your standard analytics to identify a page that receives significant traffic but doesn't perform as well as expected. You can then use a heatmap to investigate how visitors interact with that page.
This gives you a useful workflow:
Measure → investigate → make a change → measure again.
The goal isn't simply to collect more data. It's to use data to make better decisions about your website.
A visual approach to privacy-focused analytics
For website owners who choose Umami because of its privacy-focused approach, Heatmaps add another way to understand visitor behavior.
You can learn more about how the feature works, including the latest configuration and usage details, in the official documentation:
Read the official Umami Heatmaps documentation
Start exploring your heatmaps
If you're already using Umami, Heatmaps are worth exploring alongside your existing analytics.
Start with a page that matters to your website. Don't try to analyze everything at once. Pick one page and one question.
Where are visitors interacting? What are they ignoring? Are they behaving the way you expected?
Then use those observations to decide what, if anything, you should change.
Umami tells you what happened. Heatmaps help you see where it happened.
And sometimes, seeing the behavior is the fastest way to understand it.
Related reading
Heatmaps show you where visitors interact on a page. To watch recordings of a real visitor session—seeing clicks, scrolling, and navigation over time—check out our guide to Umami Session Replays: See How Visitors Actually Use Your Website. And to save reusable groups of users by the actions they took, see Cohorts in Umami Analytics: How to Group Users and Understand Behavior Over Time.
Get Started with Managed Umami
Ready to try Umami without the DevOps hassle? UmamiEngine provides fully managed Umami analytics with all the depth described above, including funnels, retention, journeys, attribution, and revenue insights. No servers, no databases, no maintenance, just privacy-first analytics in minutes. Get started today and take control of your analytics data.
Get fully managed Umami in minutes